Mathematical Description#
The description of tsam presented in the following is based on the review on time series aggregation methods by Hoffmann et al. (2020). tsam is aggregating time series by reducing the number of time steps. Generally, time series can also be aggregated by grouping similar time series as illustrated in the upper right part of the figure below. Instead, tsam is decreasing the amount of time series data by merging adjacent time steps based on their similarity (segmentation) or forming time periods along the time axis and clustering those based on their similarity. This is shown in the middle right part and the lower part of the figure below. The number of attributes to be clustered is thus not changed and accordingly, tsam is also capable of clustering multi-dimensional time series without changing their dimensionality.
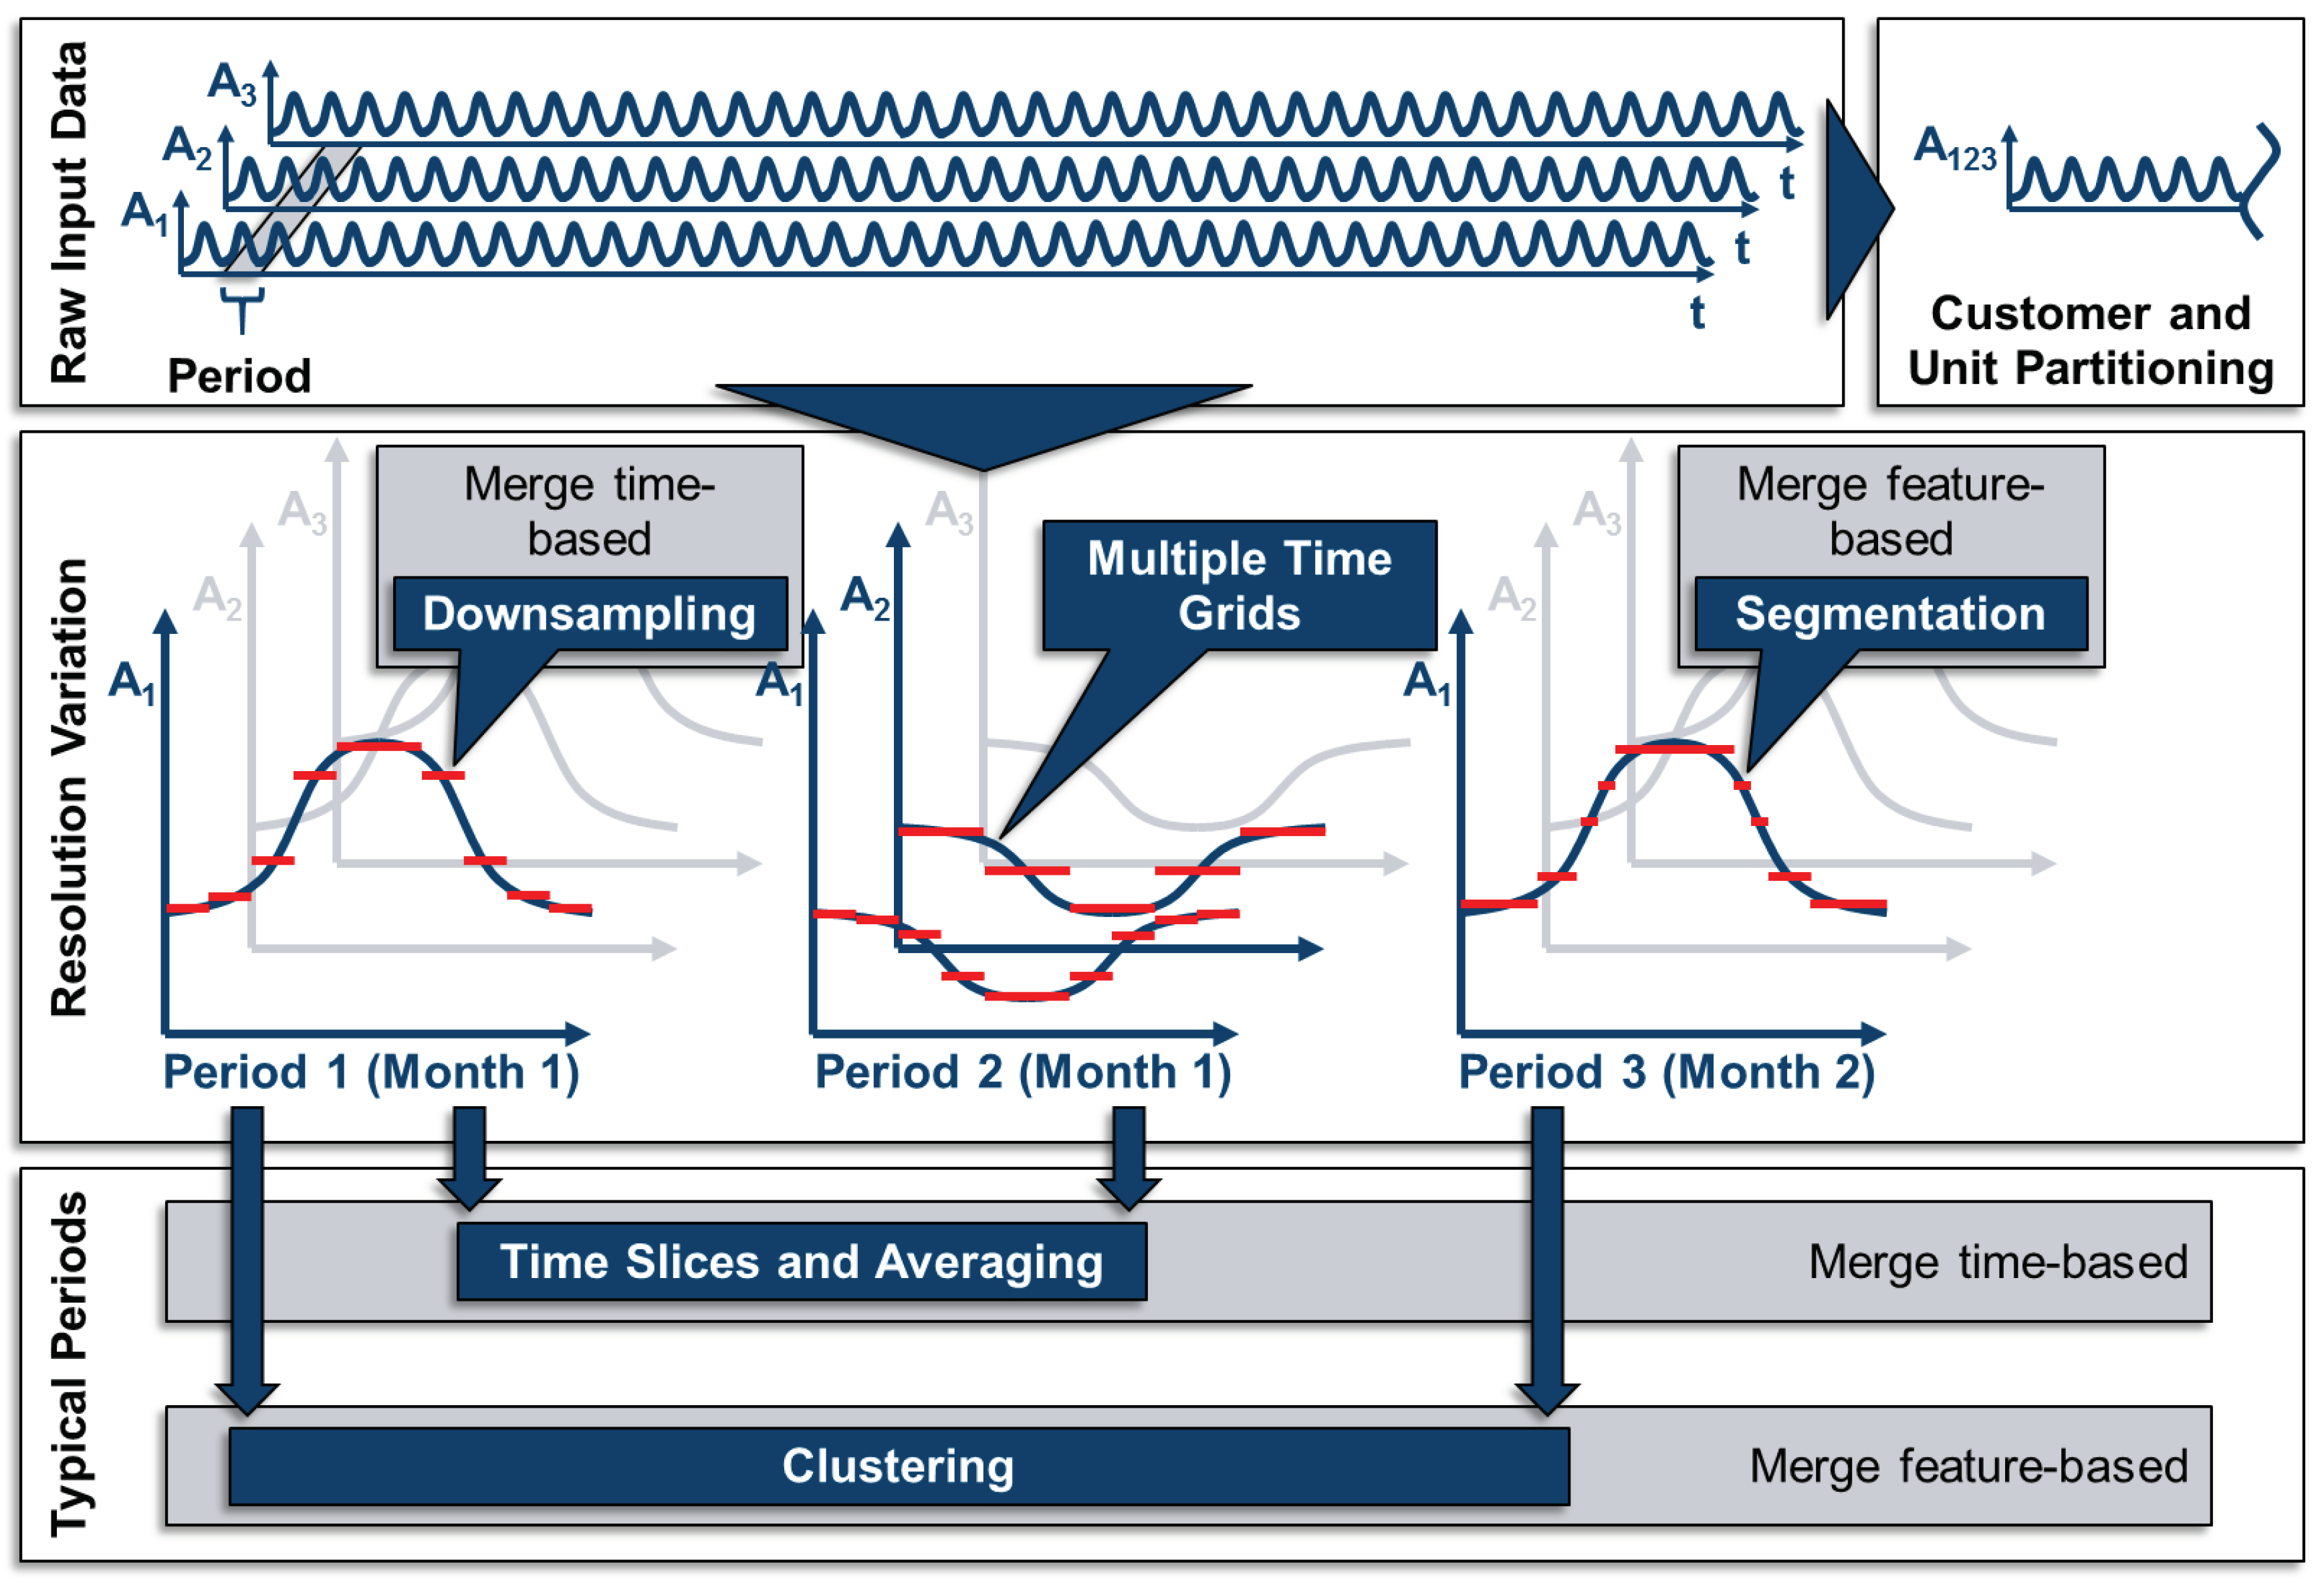
The process of clustering applied in tsam includes for different steps: Preprocessing, clustering, adding extreme periods and backscaling. This is shown in the figure below.

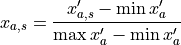
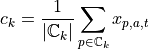
The preprocessing mainly consists of an attribute-wise normalization of all time series in order to avoid overweighting of attributes with larger scales during the clustering process:
Then, all time steps within the chosen periods (e.g. hourly time steps within daily periods) are realigned in such a way that each period becomes an own row-vector or hyperdimensional point whose dimensions are formed by the number of time steps within the periods for each attribute.
Then, clustering is applied to these hyperdimensional points. Clustering generally strives to group data points in such a way that points within a cluster are more similar to each other than data points from different clusters. An example for this is the k-means clustering algorithm with the objective function to minimize the sum of all distances of all data points to their cluster centers as given by:
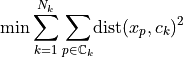
With:
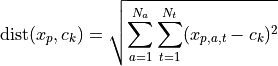
And:
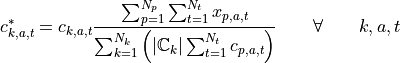
After that and since some of the clustering methods in tsam are not preserving the average value of each time series, an optional attribute-wise rescaling step according to the following equation can be performed:
In an additional intermediate step the temporal resolution of the periods can also be decreased using segmentation. In the end all time series are scaled back to their original scale:

The output of tsam are thus clustered periods with different numbers of occurences consisting of time segments with different lenghts.